Why Archer Aviation's (ACHR) Post-Earnings Tailspin Looks Like a Favorably Mispriced Opportunity

While air mobility specialist Archer Aviation (ACHR) had been on a wild ride this year, the wheels started to fall off last month. More recently, its highly anticipated second-quarter earnings report left investors wanting. The manufacturer of electric vertical takeoff and landing (eVTOL) posted a wider-than-expected net loss of $206 million. As such, ACHR stock dropped more than 4% in the afterhours session following the disclosure.
As it relates to the equity, Archer incurred a loss per share of 36 cents. Unfortunately, Wall Street analysts had anticipated a loss of 25 cents per share. With the company being a pre-revenue enterprise, market participants may have grown antsy, especially amid broader economic challenges and political uncertainty.
Not surprisingly, ACHR stock represented one of the highlights in Barchart’s Unusual Stock Options Volume screener. This readout showcases the top 500 securities generating aberrant transactions in the derivatives space relative to established norms.
In Archer’s case, total options volume hit 224,325 contracts, representing a lift of nearly 75% against the trailing one-month average. Interestingly, call volume stood at 172,887 contracts, leaving put volume at 51,438 contracts. This yielded a put/call ratio of just under 0.30, suggesting bullish sentiment. After all, calls provide holders the right (but not the obligation) to buy the underlying security at the listed strike price.
Options flow, which focuses exclusively on big block transactions likely placed by institutional investors, denoted that net trade sentiment reached $81,500 above parity. While positive, the delta leaning toward the bulls was rather minimal. Gross bullish dollar volume was $1.664 million, while bearish volume was $1.583 million.
Essentially, sentiment was evenly matched, though the biggest transaction was for debit calls expiring Jan. 16 of next year. While it’s difficult to read the smart money’s intention, there does seem to be a slight optimistic bias heading into Q2 earnings. However, whether that sentiment holds for the rest of the week remains to be seen.
Still, irrespective of whatever the alpha dogs do, retail traders may want to give ACHR stock a closer look.
Using Russian Axioms to Identify a Signal in ACHR Stock
In an earlier Barchart article, I discussed my recent framework for identifying potential opportunities in the market. Using a discrete-event analysis inspired by Russian mathematician Andrey Markov, I seek out empirically valid ideas. While a detailed explanation is beyond the scope of this write-up, one of the key differences between the Russian approach and western methodologies is that the former is descriptive whereas the latter is prescriptive.
Put another way, the western philosophy involves forecasting where the stock should be. In contrast, I look at where the security has been under similar conditions — and then reverse engineer a probabilistic path forward given the current situation.
Another element that is different from western thinking is that my model is epistemologically consistent. Too often in the financial analysis industry, you’ll hear experts state that a security offers “good value” without defining what that term means. Such definitions — and the justification for their usage — should be incorporated in a complete analysis since share prices and their derivative ratios are continuous scalar signals. As such, it’s a category error to give them discrete labels such as “good” or “bad.”
In contrast, I avoid this epistemological pitfall by discretizing price action into a binary code, thus allowing for like-to-like comparisons. Rather than describing ACHR stock as “good value,” I instead rely on the only objective truth in the equities sector: at the end of the day, the market is either a net buyer or a net seller.
From this framework, we can build a surprisingly robust risk-assessment model. For example, in the past 10 weeks, the market voted to buy ACHR stock three times and sell seven times. During this period, the security incurred a downward trajectory. For brevity, we can label this sequence as 3-7-D.
Before we get into the good stuff, we need to establish our null hypothesis, the probabilistic performance expectation of ACHR stock assuming no mispricing. On any given week, the chance that a long position in ACHR will rise is only 44.67%, a conspicuously negative bias. Therefore, if we have a trading signal, we need to be able to beat the performance implied by the null.
Thankfully, this is the beauty of our alternative hypothesis. With the 3-7-D flashing, there’s a 68.42% chance that the following week’s price action will result in upside. While there’s still a nearly 32% chance of signal failure, a risk-tolerant speculator may be incentivized to consider a debit-based strategy.
Assuming the positive pathway, the median one-week return following the 3-7-D sequence flashing is 4.79%. Should the bulls maintain control of the market for the next three weeks, there could be an additional performance boost that could drive ACHR near the $10.50 level.
Putting the Crosshairs on a Specific Trade
Using the market intelligence above, the 9.50/10.50 bull call spread expiring Sept. 12 represents an awfully tempting proposition. This transaction involves buying the $9.50 call and simultaneously selling the $10.50 call, for a net debit paid of $42 (the most that can be lost in the trade). Should ACHR stock rise through the short strike price ($10.50) at expiration, the maximum profit is $58, a payout of over 138%.
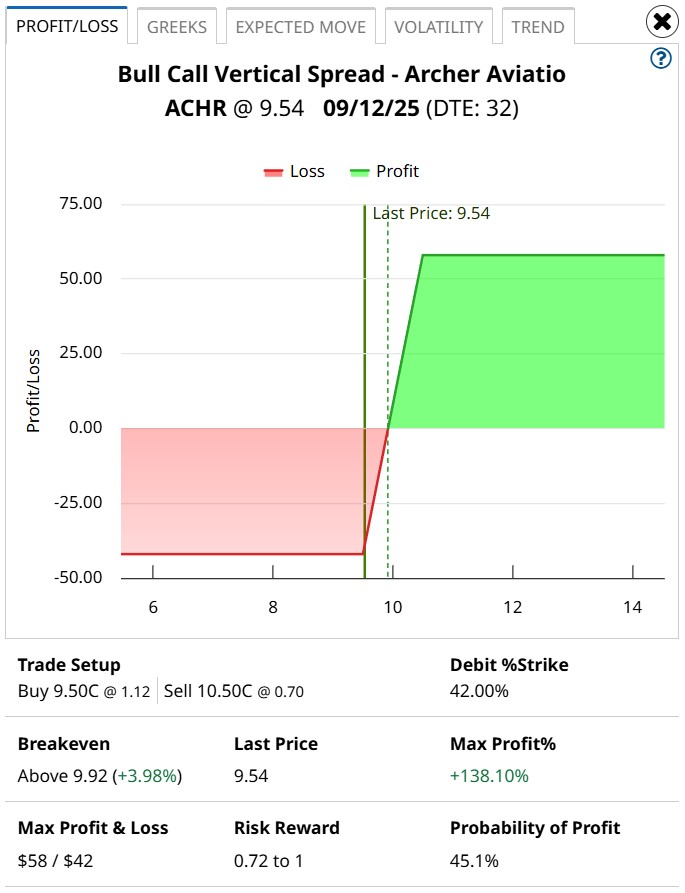
To be clear, traders will need a little bit of help. While the $10.50 target is reasonable, past analogs suggest that the median expected performance forecast is around $10.48. However, it’s important to point out that the breakeven price for this trade is $9.92. This adds a relative margin of safety.
Of course, a lot rides on the empirical viability of the 3-7-D sequence. Running a one-tailed binomial test reveals a p-value of 0.0546. This means that there’s a 5.46% chance that the implications of the signal could materialize randomly as opposed to intentionally.
Here’s the deal: the threshold for statistical significance is 5%. However, the stock market is an open, entropic system, vulnerable to wild shifts thanks to exogenous factors. So, a p-value of 0.0546? In an industry where hand-waving and presuppositional fallacies double as analysis?
I’d be hard-pressed to ignore it.
On the date of publication, Josh Enomoto did not have (either directly or indirectly) positions in any of the securities mentioned in this article. All information and data in this article is solely for informational purposes. For more information please view the Barchart Disclosure Policy here.